Results Tab
From PatioWiki
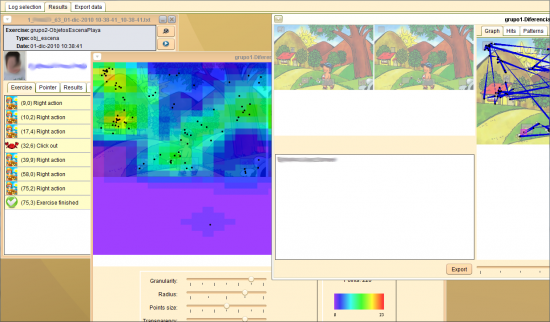
The Results Tab is a container of analysis windows, graphs and patterns. Each window can be minimized or closed, so that this tab behaves like a real desktop.
Analysis
All analysis windows have a common header which contains the Exercise name, its type and the date when it was performed. Below the header, the name and the picture of the pupil. In multi-user exercises, there are as many lines as pupils.
Besides, there are two buttons in the top right corner. The first one is for watching the video of children doing the exercise, if it is available and the multimedia player has been configured in the Configuration panel. The second button is used to replay the exercise with the Exercise Player.
Finally, there is series of tabs that are common to all analysis windows, but show different data depending on the module (APRENDO, LEO...) and the exercise type.
Exercise Tab
This tab shows a list with the data from the abstractLog section of a Log file.
The available info depends on the pupil's behaviour and the exercise type. Usually the abstractLog section contains data about high-level events which happened when the pupil was doing the exercise.
Notice that in each line of the list there is an event icon followed by the event time mark in seconds and a description of the event. By double-clicking on a line, you can visualize the image events or hear sound events.
Pointer Tab
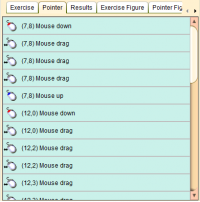
This tab shows a list with the data from the mouseLog section of the Logs files.
The available info depends on the pupil's behaviour because in the mouseLog section all low level events are recorded during the exercise performing.
Note that each line of the list has an event icon followed by the event time mark in seconds and the description of it.
More info about mouseLog events is available in the Logs topic.
Results Tab
In this tab an specific analysis of the exercise is made. As a result, data shown will be different depending on the type of exercise:
Results for Sound-Image Matching exercises
For Sound-Image Matching exercises the following data is obtained:
- Specific Indicators
- IE-1.1: Image: Click and clicked (Pupil had to click on the image and she did)
- IE-1.2: Image: No click and clicked (Pupil didn't have to click on the image but she did)
- IE-1.3: Image: Click and didn't click (Pupil had to click on the image but she didn't)
- IE-1.4: Image: No click and didn't click (Pupil didn't have to click on the image and she didn't)
- IE-1.5: Without image: No click and clicked (Pupil clicked when she shouldn't have)
- IE-1.6: Without image: No click and didn't click (Pupil didn't click when she shouldn't have)
- Common Indicators
- IC-1.1: Total of images
- IC-1.2: Average time of correct clicks
- IC-1.3: Deviation time of correct clicks
- IC-1.4: Average time of wrong clicks
- IC-1.5: Deviation time of wrong clicks
- IC-1.6: Exercise length
Results for Differences exercises
For Differences exercises the following data is obtained:
- Specific Indicators
- IE-2.1: Hits on differences
- IE-2.2: Clicks out of image
- IE-2.3: Clicks on the left image
- IE-2.4: Clicks on the right image
- Common Indicators
- IC-2.1: Game ended
- IC-2.2: Time of the first correct click
- IC-2.3: Average time of correct clicks
- IC-2.4: Deviation time of correct clicks
- IC-2.5: Exercise length
Results for Memory exercises
For Memory exercises the following data is obtained:
- Specific Indicators
- IE-3.1: Wrong clicks
- IE-3.2: Clicks on the background and before new images
- IE-3.3: Clicks on the background and after new images
- IE-3.4: Repeated wrong clicks
- Common Indicators
- IC-3.1: Correct clicks
- IC-3.2: Game ended
- IC-3.3: Time of the first correct image
- IC-3.4: Average time between correct images
- IC-3.5: Deviation time between correct images
- IC-3.6: Time of first correct image
- IC-3.7: Average time between wrong images
- IC-3.8: Deviation time between wrong images
- IC-3.9: Exercise length
Results for Objects-Scenes exercises
For Objects-Scenes exercises the following data is obtained:
- Specific Indicators
- IE-4.1: Clicks on instructions
- IE-4.2: Wrong clicks
- Common Indicators
- IC-4.1: Correct clicks
- IC-4.2: Time of the first correct click
- IC-4.3: Time between correct clicks
- IC-4.4: Average time between correct clicks
- IC-4.5: Deviation time between correct clicks
- IC-4.6: Time of the first click on instruction
- IC-4.7: Average time between clicks over instructions
- IC-4.8: Deviation time between clicks over instructions
- IC-4.9: Time of the first wrong click
- IC-4.10: Average time between wrong clicks
- IC-4.11: Deviation time between wrong clicks
Results for Reaction Time exercises
For Reaction Time exercises the following data is obtained:
- Specific Indicators
- IE-5.1: Total of images
- Common Indicators
- IC-5.1: Correct clicks
- IC-5.2: Clicks out of images
- IC-5.3: Clicks when no image is shown
- IC-5.4: Average time of correct clicks
- IC-5.5: Deviation time of correct clicks
- IC-5.6: Average time of clicks out of image
- IC-5.7: Deviation time of clicks out of images
- IC-5.8: Average time of clicks when no image is shown
- IC-5.9: Deviation time of clicks when no image is shown
- IC-5.10: Average distance of clicks out of image
- IC-5.11: Deviation distance of clicks out of image
- IC-5.12: Exercise length
Results for Choose the odd one exercises
For Choose the odd one exercises the following data is obtained:
- Specific Indicators
- IE-6.1: Consecutive correct clicks
- IE-6.2: Repeated correct clicks
- Common Indicators
- IC-6.1: Correct clicks
- IC-6.2: Clicks out of image
- IC-6.3: Wrong clicks
- IC-6.4: Time of the first click
- IC-6.5: Time of the first correct click
- IC-6.6: Average time between correct clicks
- IC-6.7: Deviation time between correct clicks
- IC-6.8: Time of the first wrong click
- IC-6.9: Average time between wrong clicks
- IC-6.10: Deviation time between wrong clicks
- IC-6.11: Time of the first click out of image
- IC-6.12: Average time between clicks out of image
- IC-6.13: Deviation time between clicks out of image
- IC-6.14: Average time between correct repeated clicks
- IC-6.15: Deviation time between correct repeated clicks
- IC-6.16: Exercise length
Results for Series
For Series exercises the following data is obtained:
- IC: Total correct images
- IE: Total wrong images
- MI: Total moved images
- MTIC: Average time of correct images
- DTIC: Deviation time of correct images
- MTIE: Average time of wrong images
- DTIE: Deviation time of wrong images
- MTIFC: Average time of moved images
- DTIFC: Deviation time of moved images
- DE: Exercise length
Results for Series Multiuser
For Series Multiuser exercises the following data is obtained:
- Single Indicators
- I.1: Total correct images
- I.2: Total wrong images
- I.3: Total moved images
- I.4: Turns taken
- I.5: Turns transferred
- I.6: Illegitimate turns
- I.7: Score
- Group Indicators
- G.1: Exceeded turns
- G.2: Number of players
- G.3: Placed images
- G.4: Group score
- G.5: Exercise length
Results for Writing
For Writing exercises the following data is obtained:
- Ex1: Total of reproduces videos
- Ex2: Exercise length
Results for Letter Cloud
For Letter Cloud exercises the following data is obtained:
- Ex1: Total token hits
- Ex2: Total token misses
- Ex3: Total identification hits
- Ex4: Total identification misses
- Ex5: Exercise length
Exercise Figure Tab
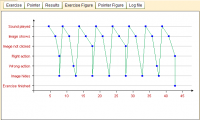
This tab contains a graph produced with the data from the abstractLog section of the Logs files. The Y axis represents the exercise events, and the X axis is used for the exercise time; its length depends on the amount of time the user spent on doing the exercise.
In the same way as in the Exercise Tab, the data available will change depending on the pupil's behaviour and the type of exercise.
Note that the goal of this analysis is building a temporal diagram showing the pupil's actions in order to draw visual inference from her behaviour and the order she followed to do the exercise.
Pointer Figure Tab
This tab contains a graph produced with the data from the mouseLog section of the Logs files. The Y axis represents the pointer events, and the X axis is used for the exercise time. Like in the previous tab, the length of the time axis depends on the time pupil spent doing the exercise.
Note that this figure could be hard to read when the pupil behaves erratically without achieving the goal of the exercise.
More info about mouseLog events is available in the Logs topic.
Extra Tab
This tab is only visible in the analysis of exercises of the Differences and Objects-Scenes types from the APRENDO module and for exercises of the Writing type from the Leo module. It contains a graph formed by dots which represent the clicks made by the pupil. The dots are connected by arrows in order to show the sequence the pupil has followed.
Using a slider you can go forward or backward in the sequence of dots. There is another slider for changing the level of transparency of the background image of the exercise. As a result, all dots can be seen clearly.
There is a different manner of replaying exactly the way the pupil completed an exercise, using the Exercise Player.
Log File Tab
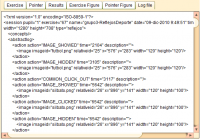
In this tab, the last one, you can see the log file coded in XML, in case you want to check the analysis made at a very low level.
Graphs
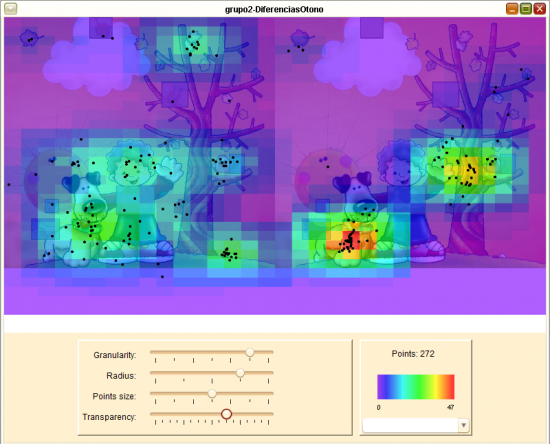
This graphical analysis only can be performed in exercises of Differences and Objects-Scenes types because only they involve searching for objects in an image. This exercise is ideal to analyse the search points that pupils have clicked with the pointing device.
Since the graph shows the search points made in the exercise, you can combine many exercises of the same type and the same window dimensions. Then, the analysis adds a layer on the top of the exercise, drawing with different colours the point density for each delimited area. This representation can be modified changing the graph parameters with the sliders of the bottom panel:
- Granularity
- Changes the dimensions of the array cell.
- Radius
- Controls the influence of the neighbour cells on the value of each single array cell.
- Points size
- Modifies the size of points.
- Transparency
- Controls the transparency level of the density layer, so background image can be gradually unveiled.
Besides, a scale is provided in order to assign to each colour of the graph the number of points that it represents. Above the scale, you can read the total number of points in the graph and at the bottom of the panel you can select the name of the pupil whose points will be highlighted. This combo box is initially blank and it is useful only in graphs showing points of more than just one pupil.
Patterns
The exercises of Differences and Objects-Scenes types have search points that can be interpreted like patterns. This analysis calculates the Search and Hits patterns and allows us to see the combined directional graph for many pupils, all in the same window.
This window has three parts. A directed graph in the top left panel where you can view the search point of the selected pupil; a list in the bottom left panel where you can select the pupil to be highlighted; and a panel on the right that contains three tabs:
- Graph
- Contains all directed graphs from the analysed logs in which the selected pupil from the list will be highlighted.
- Hits
- Contains all hit patterns calculated using the analysed logs.
- Patterns
- Contains all click patterns calculated using the analysed logs.
Finally, you can export in a CSV file all the patterns from the analysis using the Export button.
